Search results for tag #monitoring
![[?]](https://assets.chaos.social/accounts/avatars/000/086/780/original/7699ff6b67e4070f.jpg)
#XING mach jetzt voll auf #KI.
🤢
Ohne es zu wollen hat mir die KI eine Suchanfrage geschrieben...
"Ich bin auf der Suche nach einer Vollzeitstelle als Systems Engineer in Augsburg, idealerweise auf der Ebene mit Berufserfahrung bis hin zu einer Managementposition. Ich bringe Kenntnisse in Systemintegration, DevOps und Automatisierung mit. Mein Wunschgehalt liegt bei 80.000 €."
Ich lach mich schlapp.
Management? Auf Keinen Fall.
80k? No way das zu bekommen...
Wo #Linux und #Monitoring?
![[?]](https://jit.social/system/accounts/avatars/109/619/060/185/835/179/original/92a81ef24b2c7411.jpg)
System-Monitoring in hübsch? Bitteschön: **btop**! 📊
Heute im #toolsday: btop. CPU, RAM, Disk-I/O und Netzwerk-Traffic – alles auf einen Blick mit fantastischer Optik.
![[?]](https://social.la10cy.net/system/accounts/avatars/108/420/908/007/657/877/original/19d324a4c6322915.jpg)
![[?]](https://files.mastodon.social/accounts/avatars/110/966/718/965/472/697/original/fac2bee55c11faab.jpg)
Modern #compliance requirements demand more than #monitoring dashboards, they require verifiable, long-term observability.
In this article from Ayedo, explore how to build a compliance-ready #observability platform using:
![[?]](https://media.burningboard.net/accounts/avatars/109/892/422/024/311/931/original/f22e604f554272c0.png)

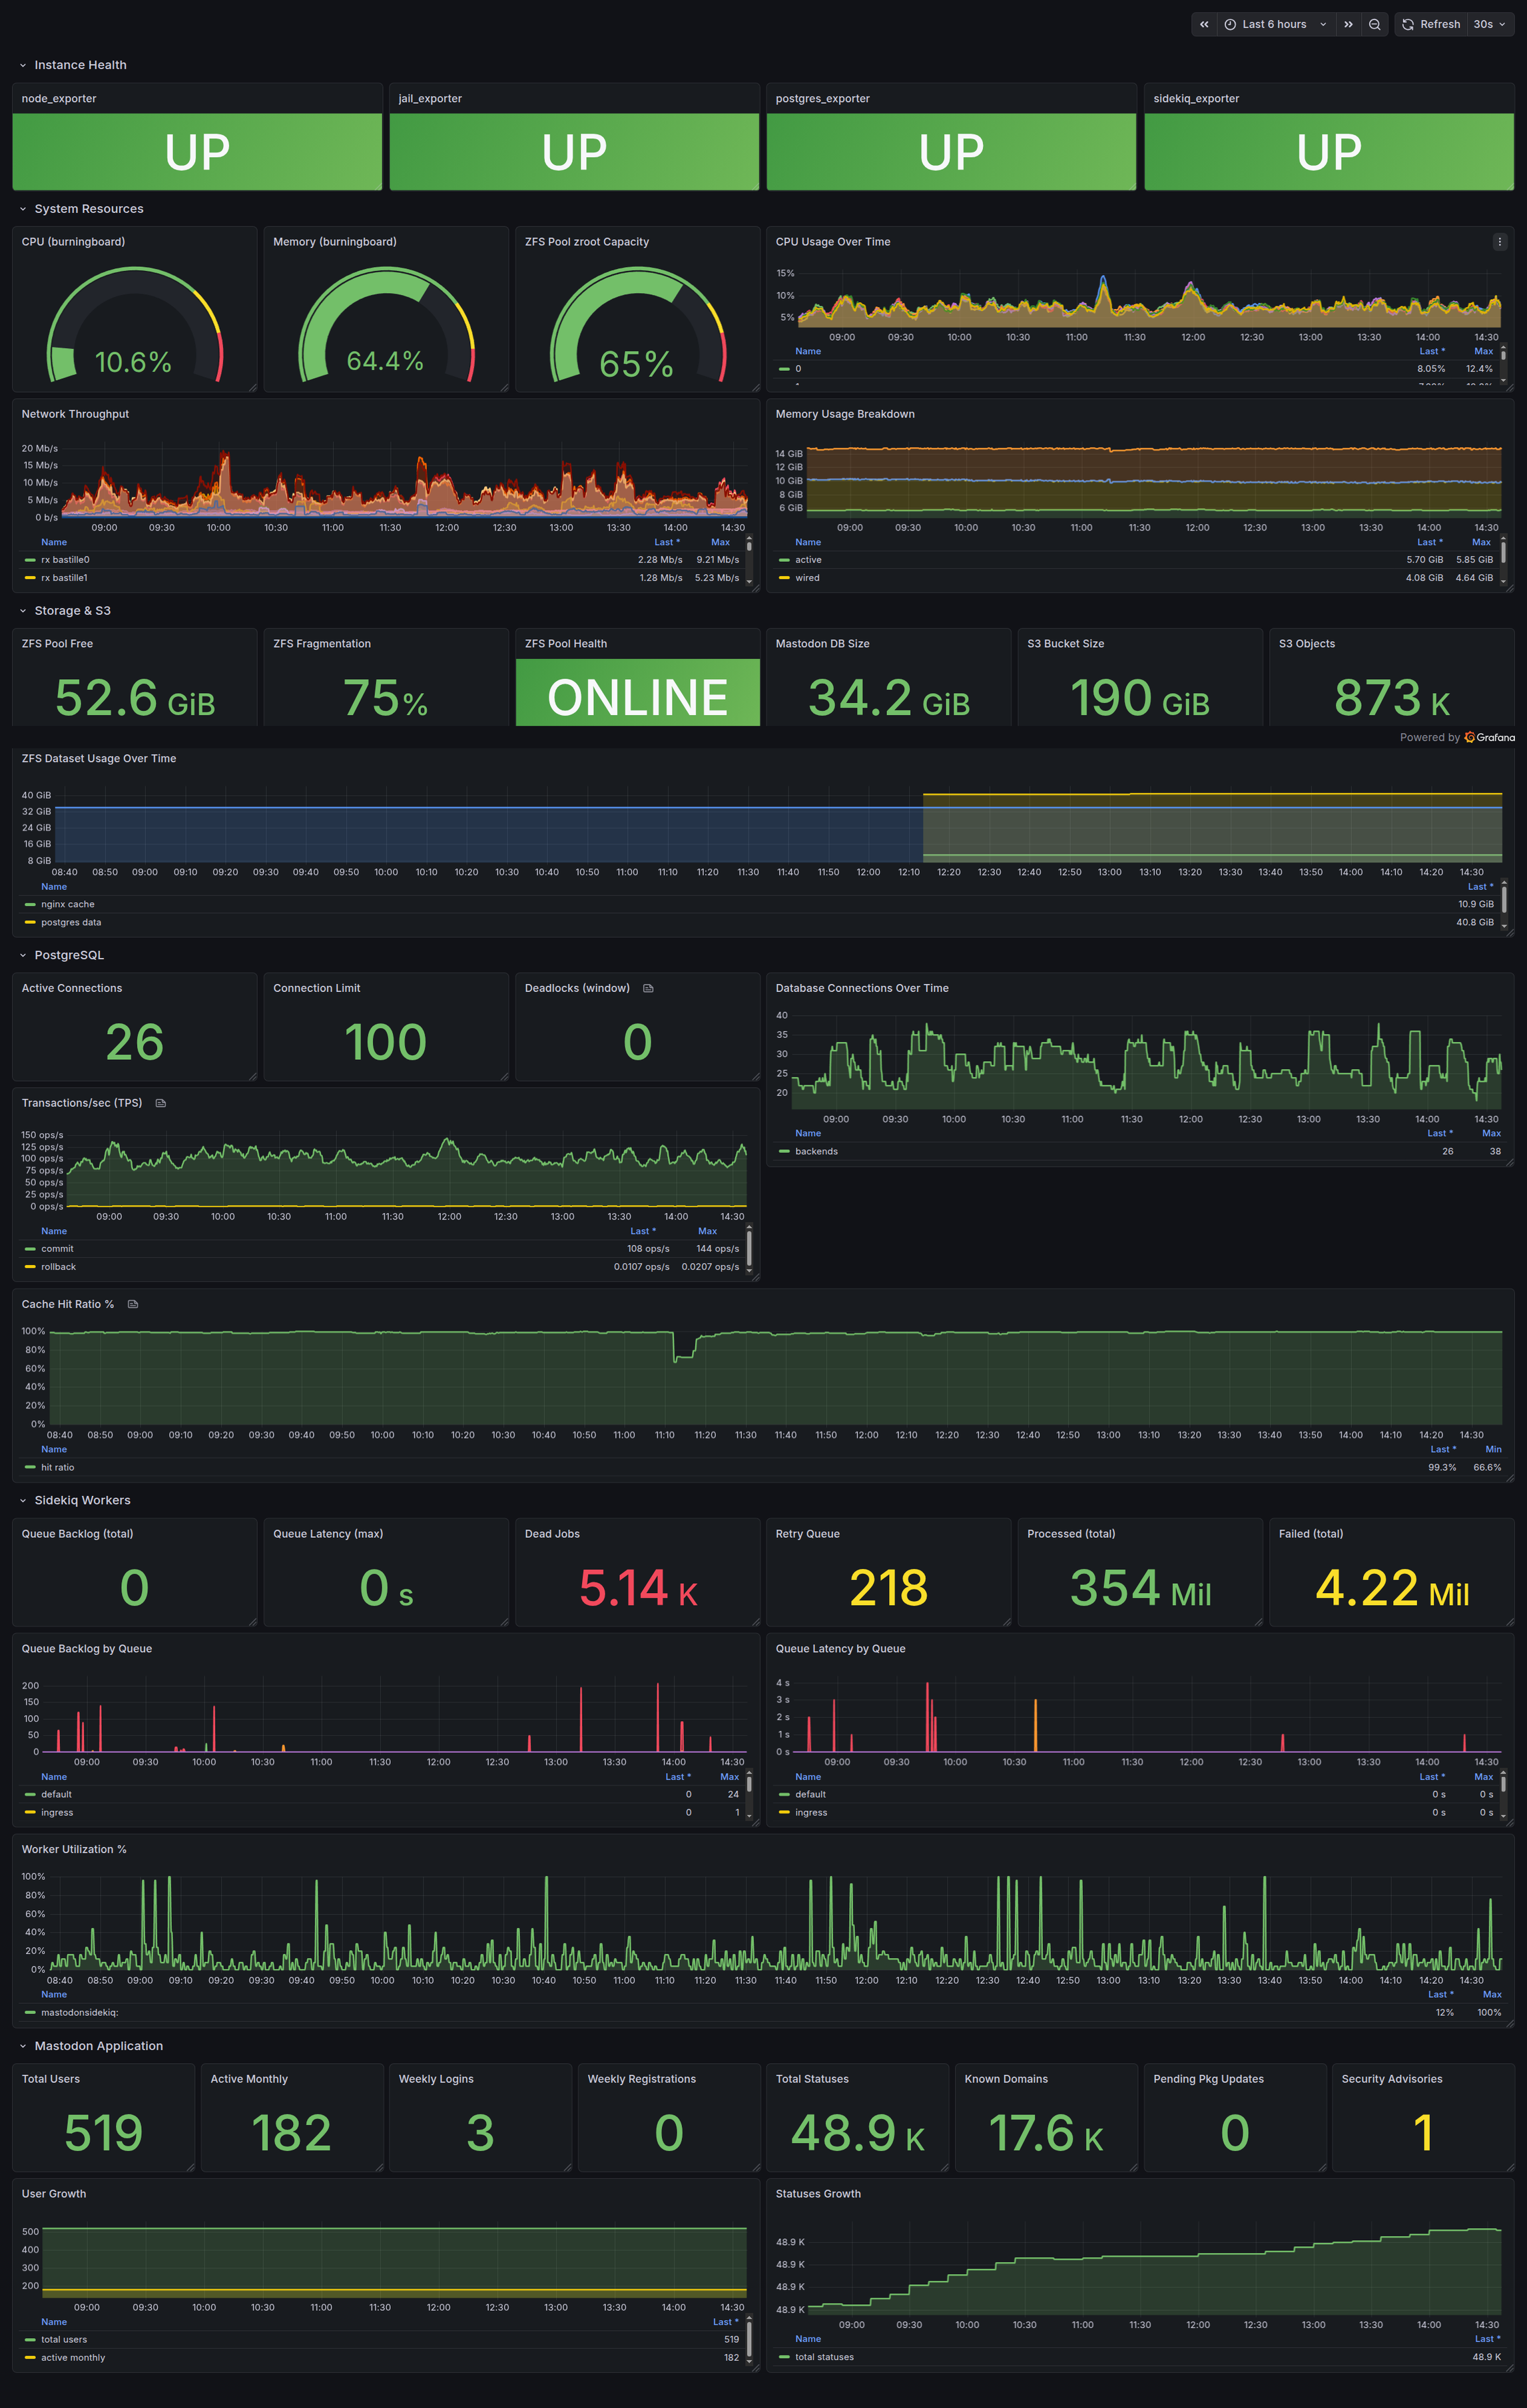
From the engine room: Built a new overview dashboard for our Mastodon instance burningboard.net with all the important stats:
- System overview
- Sidekiq statistics
- Database health
- S3 Bucket utilization
- Mastodon statistics
Starting to look really good and helpful :-)
#mastoadmin #mastodon #freebsd #grafana #monitoring @tux
![[?]](https://gotosocial.tourmentine.com/fileserver/01Q1APFQ6C512Y9TCGTGT3WQBD/attachment/original/01KGAVKZKS46Z6T88CYXSSHA6D.gif)
![[?]](https://media.burningboard.net/accounts/avatars/112/014/731/818/059/861/original/563122bb9a51f781.jpg)
UGREEN NAS-APP: SYSTEMSTEUERUNG, DATEIEN UND MONITORING IM ALLTAG – TUTORIAL
https://gadgetchecks.de/ugreen-nas-app-systemsteuerung-dateien-und-monitoring-im-alltag-tutorial/
.
.
.
#ugreen #ugreennas #ugreennasapp #ugospro #nas #systemsteuerung #dateien #monitoring #speicher #netzwerkspeicher #homeserver #datenspeicher #nasverwaltung #mobileverwaltung #appcenter #tutorial #anleitung #technik #backup #techguide
They will explore how engineers with varied experiences influence design, operations, and scaling, highlighting areas such as abstraction boundaries, self-service workflows, API touchpoints, onboarding paths, and documentation.
Watch on demand 👇
https://bit.ly/4sa2Sv1
![[?]](https://social.dk-libre.fr/social/oldsysops/s/7e93fa6bf16b47da4f57ddf9072aff8c.png)
j'ai 2 besoins principaux :
- la communication sur les incidents (avec historique)
- avoir un uptime sur les services (idéalement d'un an... on a les SLA qu'on peu).
- openstatus (trop compliqué a installé hors docker) j'ai l'impression que ca fait le café mais avec des choix technologiques particulier.
- statusnook (installtion super simple en mode curl|bash que je n'ai pas fait, on regarde toujours avant d'exécuter)
- cachet (installation simple qui n'impose pas docker)
#sysadmin #monitoring #cachet #openstatus
#uptime #kuma
et sinon vous, vous utilisez quoi ?
Hallo Berlin!
#VictoriaMetrics is a 🥉bronze Sponsor at the WeAreDevelopers World Congress.
Join us, the World’s Largest Event for Developers, AI Builders & Tech Leaders.
Visit our booth 2_08-4 (Hall 2), and learn more about #monitoring, #logs, #traces, and #metrics.
See you in Berlin, Germany, July 8-10!
https://bit.ly/4fJgBFT
#TechConference #observability

![[?]](https://cdn.masto.host/floss/accounts/avatars/000/056/291/original/27995fdd54dd1220.jpg)
Impromptu Adventures with Zabbix, another fun topic from Alyssa Druckenbrodt at @PLUG
Description: Lessons and quirks learned by a Zabbix newbie while deploying to a large production environment quickly and without prior scoping and planning.
This Thursday @ 19:00 AZ ( UTC - 7 )
1702 E Highland, Phoenix
@FLOSS_Stammtisch is next Tuesday on the 16th also starting at 19:00
#LocalGroup #Phoenix #Arizona #FLOSSgroup #LUG #PLUG #Stammtisch #FLOSS_Stammtisch #Zabbix #monitoring
🔍 Better #VMUI debugging + query visibility: raw query now shows NaN, stale markers, and nulls, with precise graph tooltips and improved Top Queries UX.
🚀 First Operator #LTS release: a long-term support version that provides stability and predictability for production environments.
Learn more in our latest article 👇
https://bit.ly/4dWHNj7
We'll cover:
✅ #Metrics, #logs, and #traces
✅ #OpenTelemetry integration
✅ #AI (with #MCP)
✅ Dashboards
See you there!
https://bit.ly/3RPOoTZ
![[?]](https://files.techhub.social/accounts/avatars/116/555/014/314/243/728/original/7e85a577daa49675.png)
🐧 Hardware-Monitoring für einen Ubuntu-Fileserver — in einer Session gebaut! 🚀
~50 Interaktionen, ca. 30 Minuten. Ergebnis:
▫️ sensors.sh — CPU (Package + 6 Cores), NVMe, ACPI Temps
▫️ disks.sh — SMART für HDD (20TB Exos) + NVMe SSD
▫️ system.sh — CPU, RAM (DDR5-Slots!), GPU, BIOS, Mainboard via dmidecode
▫️ mergerfs.sh — Pool-Übersicht: Belegung, Inodes, Berechtigungen
▫️ updates.sh — apt update/upgrade + Neustart-Check
▫️ check-all.sh — Master-Script, läuft alles durch
▫️ mail.sh — Mail-Versand via SMTP
▫️ Custom opencode Skill „log-summary" — liest Log, fasst zusammen, sendet per Mail
▫️ Cron-Job: täglich 01:00 → Check → Zusammenfassung → Mail 📧
Jeden Morgen eine kompakte Übersicht im Postfach — alle Temperaturen einzeln, SMART-Status, Storage, Updates. Nur Alarme wenn was nicht stimmt.
Tech-Stack: Ubuntu 26.04, smartmontools, lm-sensors, dmidecode, mergerfs, opencode AI, Python smtplib, cron
#Linux #SysAdmin #Monitoring #HomeLab #mergerfs #SMART #OpenSource #Automation
thanks to: #qwen36plus
Beyond technical innovation, the conference highlighted how inclusion, accessibility, and diverse perspectives are essential to building resilient systems and communities, underscoring that true success in cloud-native depends as much on people as on platforms.
Read the full blog post here 👇
https://bit.ly/3Qe4mqt
Did you miss #Kubecon?
Our Dev Rel, @dianatodea, participated in the Platform Resilience, Built on Belonging panel
Behind every high-impact Internal Developer Platform (IDP) lies a socio-technical system, but many platform teams struggle not with #YAML or #APIs but with attracting and retaining the right talent. A vast pool of skilled engineers hesitate to apply because they don't feel they belong, leaving organizations unknowingly missing out on innovation.
https://bit.ly/4wVRYfh
#Monitoring

Missed our latest Virtual Meetup? 👀
Watch this short now and learn more about, #MCP server support and AI dashboards are now available in VictoriaMetrics Cloud 🚀
https://bit.ly/4nWAHhR
#Observability #monitoring #cloud

#VictoriaMetrics is a 🥇 Gold Sponsor at South East Linux Fest 2026. Join us and explore the #linux #OpenSource world of #observability and #monitoring, whether #logs, #traces, or #metrics.
See you in Charlotte, North Carolina, June 12-14!
https://bit.ly/49Jhla4
#TechConference #SELF2026 #OpenSource
🎧 When your #observability stack struggles to handle growth, it’s time to reconsider. Spotify had to replace its outdated in-house #TimeSeries database due to stability problems and performance issues that led to slow queries and timeouts. To achieve high-throughput data ingestion, quick query responses, and dependable alerting at scale, Spotify’s Observability team selected VictoriaMetrics, recognized as the fastest #monitoring and observability tool available.

This may require substantial CPU, RAM, disk I/O, and disk space to store and query large log volumes. In this talk, we will look into different strategies of storing those #logs in #ElasticSearch, #Grafana, #Loki, and VictoriaLogs and examine how we can save 10x or more on infrastructure costs.
Thanks to everyone who attended the session and stopped by to chat with the team 🚀
cloudnativedays.ro
#Observability #CloudNative #Monitoring #DevOps #SRE #monitoring #CNDRomania2026 #CloudNative
🏨 #Airbnb now has a 100M samples/sec pipeline powered by #vmagent + #OpenTelemetry
🪜 VictoriaMetrics v1.142.0 provides critical fixes: #OTEL ingestion + query bugs. Please upgrade as soon as possible
🪵 VictoriaLogs v1.50 adds Splunk HEC, Datadog native paths, file log collection
🆔Multiple improvements in VictoriaLogs #LogsQL: multi-field search, stddev(), global filters, CSV exports.
Learn more in our latest article 👇
https://bit.ly/4ue33GM
Did you catch our latest Virtual Meetup? 👇
In our Q1 2026 session, we shared the latest community and event updates, including highlights from #KubeCon Europe 2026 in Amsterdam and what’s coming next.
🎥 Watch now: https://bit.ly/4uOsVZU
#Observability #Monitoring #Logs #DevOps

![[?]](https://cdn.masto.host/enosmtown/accounts/avatars/109/341/527/116/255/990/original/16fee146425349c3.jpg)
I figured out (with some help) how to use an SQL database to monitor #apache with #Grafana, skippimg Prometheus or Loki, which (I think) would explode trying to handle IPv4s, URLs, refrers or User Agents:
https://www.grulic.org.ar/~mdione/glob/posts/monitoring-apache-with-sql-and-grafana/
Missed #KubeCon + #CloudNativeCon Europe 2026? We’ve got you covered.
Three of the four VictoriaMetrics founders answered the community’s biggest questions about #observability, #OpenSource licensing, #AI and the future of the ecosystem.
Watch the full interview here 👇
#monitoring #traces #logs #Kubernetes

I had one problem (graphing different things from HTTP server logs), made a database that I can read from #Grafana, but now I have two problems (learns more #SQL so I can make my graphs).
For instance, this is my useless attempt to graph status code by time:
```
SELECT timestamp AS time, COUNT(status) as value
FROM logs
WHERE timestamp >= $__from / 1000 and timestamp < $__to / 1000
GROUP BY status
```
Anyone knows a good tutorial about it?
Our software engineer Zhu Jiekun explains how #RetroactiveSampling helps reduce #DistributedTracing traffic and ingestion costs, by sending minimal data for sampling decisions and retrieving full spans only when needed.
Watch now 👇
https://bit.ly/4nlyXyt

![[?]](https://media.bsd.cafe/bsdmmedia01/accounts/avatars/110/740/169/477/916/693/original/dfa8f1b9beefa405.png)
Monitor your devices with LibreNMS on FreeBSD
A guide on how to set up LibreNMS inside a FreeBSD jail.
https://it-notes.dragas.net/2026/05/07/monitor-your-services-with-librenms-on-freebsd/
#ITNotes #FreeBSD #Monitoring #Server #OwnYourData #Alerting #IT #SysAdmin #LibreNMS
We’re excited to share that #VictoriaMetrics is a 🪙 Platinum Sponsor at #Observability Summit North America! Dive into the #OpenSource ecosystem of #observability and #monitoring, logs, #traces, and #metrics.
See you in Minneapolis, Minnesota, May 21-22!
https://bit.ly/3QFw4MQ
![[?]](https://stockage.framapiaf.org/framapiaf/accounts/avatars/000/000/005/original/ee2668cd5dd7fd61.jpg)
A new version of #Argos has been released: 0.10.3!
https://framagit.org/framasoft/framaspace/argos/-/releases/0.10.3
#ArgosPanoptès #Monitoring
#Proxmox #PVE #monitoring #metrics #opensource
https://gyptazy.com/blog/grafana-dashboard-for-pegaprox-prometheus-exporter/
When migrating to a new #monitoring system, most teams focus on dashboards and alerts first.
A better approach?
👉 #Frontload metric collection
Get all your metrics flowing into the new system as early as possible.
A new version of #Argos has been released: 0.10.2!
https://framagit.org/framasoft/framaspace/argos/-/releases/0.10.2
#ArgosPanoptès #Monitoring
A new version of #Argos has been released: 0.10.1!
https://framagit.org/framasoft/framaspace/argos/-/releases/0.10.1
#ArgosPanoptès #Monitoring
Argos monitoring vient de sortir en version 0.10.0 !
C’est un outil de surveillance de sites web prévu pour une surveillance à grande échelle. Chez @Framasoft, on a 45 158 sondes différentes, sur 6 446 sites différents, et ça passe crème… faut dire que c’est pour ça qu’on l’a fait développer par @almet 🙂
(et on continue le développement depuis).
À l’occasion de cette version, j’ai changé de logo et ajouté une mascotte 
https://argos-monitoring.framasoft.org/
#ArgosPanoptès #Argos #Monitoring #AdminSys

Alt...
Un paon dessiné, avec « Argos monitoring » écrit à côté de lui
A new version of #Argos has been released: 0.10.0!
https://framagit.org/framasoft/framaspace/argos/-/releases/0.10.0
#ArgosPanoptès #Monitoring
![[?]](https://files.mastodon.social/accounts/avatars/000/337/388/original/4a2c1827553a14fc.jpg)


Tune in to our next Virtual Meetup – Live April 16th at 5 pm GMT / 6 pm CEST / 9 am PT on our YouTube Channel 👉https://bit.ly/4dJXTNq
📔 Agenda:
🟣 VictoriaMetrics Roadmap Update
🚀 Anomaly Detection & #Cloud
📌 #VictoriaLogs Roadmap
🌍 Community News + AMA
Don’t miss the chance to learn, ask questions, and connect with the #VictoriaMetrics community.
#Monitoring #Observability #OpenSource #logs #metrics

![[?]](https://stockage.framapiaf.org/framapiaf/accounts/avatars/000/115/045/original/08355dabfbb74ab7.png)
#LittleSnitch’s software counter #surveillance jumps from #Mac to #Linux. The popular #macOS app brought its #network #monitoring #tools over to Linux this week.
https://www.theverge.com/tech/909975/little-snitch-linux-launch
Test a new datasource with demo #log-derived metrics data using our public playground 👇
https://bit.ly/4ch5jW2
#Observability #Monitoring
After 7+ years of creating content, Xavki also shares honest lessons and practical advice for developers who want to start sharing their knowledge in the #TechCommunity.
If you're thinking about building your voice and growing in #DeveloperExperience, this one’s worth your time.
👉 Watch now https://bit.ly/4voneCY
He deep dive into the new #VictoriaMetrics MCP Server, not just talking about #AI but building with it.
From a builder's perspective, he walks through how we integrate AI with time-series data to tackle real #monitoring challenges. Expect a demo grounded in reality, showcasing what's possible today and what still needs work.
Save the date today! 👇
https://osoday.com/
What’s the best #observability signal to start with?
In #Telemetry Talks episode 3, our engineer Alexander Marshalov breaks down how choosing the right signal from the beginning can save time, reduce noise, and set you up for better observability from day one.
If you’re working with #metrics, #logs, or #traces, this is a great place to start.
Watch the short here on YouTube 👇
https://bit.ly/416PNqC
#OpenTelemetry #DevOps #Monitoring #TelemetryTalks

📅 Join us live on our YouTube Channel. April 16th at 5 pm GMT / 6 pm CEST / 9 am PT.
📔 Agenda:
🟣 VictoriaMetrics Roadmap Update
🚀 Anomaly Detection & #Cloud
🧵 VictoriaTraces Roadmap Update
📌 #VictoriaLogs Roadmap
🌍 Community News + AMA
Don’t miss the chance to learn, ask questions, and connect with the #VictoriaMetrics community.
👉 Save the date & join us live!
https://bit.ly/3PKWEDI
#Monitoring #Observability #OpenSource #logs #metrics #traces

#VictoriaMetrics is a 🥇 Gold Sponsor at @lfnw 2026. Join us and explore the #linux #OpenSource world of #observability and #monitoring, whether #logs, #traces, or #metrics.
See you at Bellingham Technical College, April 24–26!
https://bit.ly/3NGNtDL

#CloudFest is happening today until 6pm 🚀
Stop by and let’s talk all things #Observability. From #Traces to #Logs and #Metrics. Whether you’re scaling or optimizing, we’ve got insights (and some swag 😉).
And don’t miss it…
Tomorrow is the final day, from 9am to 6pm ⏳
Come by, say hi, and let’s dive into your challenges 👇
#CloudFest #OpenTelemetry #Monitoring #DevOps #SRE


If you’re attending, let’s connect to discuss how teams are scaling observability, #logs, #metrics, and cloud monitoring efficiently and how VictoriaMetrics helps make high-volume #monitoring more reliable and cost-effective.
We’re looking forward to meeting fellow engineers, architects, and operators shaping the future of cloud.
👉 https://bit.ly/47my81r
OpenTelemetry collector buffers spans from the node/cluster it resides in, sending only necessary data to the centralized trace backend for decision-making. The backend then requests raw spans only if the trace is marked as sampled.
📆 When?
March 24th - 5 pm CET
📍 Where?
Hall 12
See you in the Netherlands! 👇
https://bit.ly/4uvX4O3
#VictoriaMetrics will be at #KubeCon Europe 2026 in Amsterdam.
🎤 @dianatodea, our developer advocate, and Elif Samedin - https://airdna.co, will present "Who Built This Platform? Alternative Viewpoints on Platform Design"
When?
📅 March 23 · 09:25 CET
Where?
📍 Hall 8 · Room F
See you in Amsterdam!
https://bit.ly/4sa2Sv1
#Observability #Monitoring #metrics

📅 March 23–26
📍 Europa-Park, Rust
If you’re attending, let’s connect to discuss how teams are scaling #observability, #logs, #metrics, and cloud monitoring efficiently and how VictoriaMetrics helps make high-volume #monitoring more reliable and cost-effective.
We’re looking forward to meeting fellow engineers, architects, and operators shaping the future of cloud.
🎙️ Telemetry Talks – Episodio 2 ya está disponible
En este episodio, @dianatodea Developer Advocate, conversa con Jose Gómez-Sellés, VictoriaMetrics Cloud Lead, para profundizar en:
☁️ ¿Qué es #VictoriaMetrics #Cloud y qué problemas está diseñada para resolver?
💰 El modelo de precios y cómo funcionan los excedentes, sin sorpresas.
🔌 Integraciones y conectividad con #OpenTelemetry y más allá.
▶️ Míralo ahora en nuestro canal de YouTube
https://bit.ly/3NqLMKi

Come as you are. Bring your stories from the day.
Let’s unwind.
RSVP to save your spot.
https://bit.ly/4rWm7bm
🎙️ Telemetry Talks Episode 2 is live!
In this episode, @dianatodea, Developer Advocate, talks with Jose Gómez-Sellés, VictoriaMetrics Cloud Lead, to dive into:
☁️ What #VictoriaMetrics #Cloud is and the problems it’s designed to solve.
💰 The pricing model and how overages work with no surprises.
🔌 Integrations and connectivity with #OpenTelemetry and beyond.
▶️ Watch it now on our YouTube channel
https://bit.ly/4aYyI6B

VictoriaMetrics is heading to 🇩🇪 Germany this March for CloudFest 2026, and we’re proud to be sponsoring this incredible gathering of cloud, hosting, and infrastructure leaders.
📅 March 23–26
📍 Europa-Park, Rust
If you’re attending, let’s connect to discuss scalable #observability, #metrics, and cloud #monitoring

🚀 Just 1 week until #Scale23x! We're thrilled to be a🏅 Gold Sponsor.
Passionate about #Observability and #Monitoring? 🔍 Join #VictoriaMetrics, the high-performance, #OpenSource time series #database built to tackle your toughest workloads. 💪
We deliver speed, efficiency, and scale.
Let’s connect in Pasadena, CA! 🌟
https://bit.ly/4amq55G
#TechConference #TimeSeriesDatabase #monitoringsolutions

🚀 Need a high-scale cluster deployment for your managed #metrics?
Large-scale environments always demand a tailored approach, and our experts can help you configure your setup to exactly match your needs.
Running a PoC with our monitoring team ensures you get the most efficient architecture, helping you optimize costs with tailored, ad-hoc #VictoriaMetrics Cluster deployments.
Learn about starting a PoC with our experts: https://bit.ly/4bdKlrF
#Monitoring #Observability

📍 Utopicus Paseo de La Habana. Sala Resistencia - Madrid
⏰ February 26th - 6 pm CEST
See you there 👇
https://bit.ly/4qTjINj
#Tech Talk #logs #monitoring #traces