Search results for tag #prometheus
![[?]](https://media.burningboard.net/accounts/avatars/109/892/422/024/311/931/original/f22e604f554272c0.png)

New post: Monitoring our FreeBSD Mastodon instance.
burningboard.net runs as a stack of Bastille jails on FreeBSD, so I watch it from a separate box with Prometheus, Grafana and Loki. The interesting part is the FreeBSD-shaped gaps: no native ZFS metrics, nothing for the Mastodon API or our S3 media bucket. A small textfile collector fills all of it.
This is how I keep an eye on the very instance I'm writing this on:
https://blog.hofstede.it/monitoring-a-freebsd-mastodon-instance-with-prometheus-grafana-and-loki/
![[?]](https://files.mastodon.social/accounts/avatars/110/966/718/965/472/697/original/fac2bee55c11faab.jpg)
May was awesome for the VictoriaMetrics #Observability Stack 🚀
We’ve introduced a range of updates and new features across VictoriaMetrics.
📊 Native #Prometheus histograms support: native histogram ingestion is now supported across vmagent, vmsingle, and cluster.
🛡️ More reliable vmagent shutdown: draining in-memory queues before fallback, reducing alerting gaps.
🔄 Smarter rerouting: improved vminsert handling to avoid rerouting storms and stabilize ingestion.

At a large enough scale, #observability becomes a systems design problem worth studying. In this post, we’ll walk through how Airbnb got there, why aggregation was essential, and how vmagent became the piece that completed the puzzle. 👇
https://bit.ly/4xaJHnG
This talk presents a simple, technical workflow for observing Kubernetes policy behavior using Kyverno and VictoriaMetrics. Starting from a single validation policy, we show how policy evaluations and enforcement results are exposed as metrics, ingested into VictoriaMetrics and queried through a standard #Prometheus-compatible API. A minimal dashboard is then used to inspect policy failures, affected namespaces, and policy execution duration.
📍 The East Hub
🕣 02:35 PM
The Challenge?
- Performance bottlenecks with individual #Prometheus instances hitting CPU and memory ceilings
- #Alerting pipelines where reliability is non-negotiable
- Heavy operational overhead from managing a complex federated architecture
With #VictoriaMetrics, DSV optimized efficiency, scalability, and reliability across their Kubernetes environments.
👉 Learn more in our case study
https://bit.ly/4vmBI5r
Scaling #Kubernetes #observability isn’t just about collecting more metrics. It’s about making them usable at scale.
At Global Transport and Logistics, a global leader in freight and logistics, the team chose #VictoriaMetrics to overcome the limits of their federated #Prometheus setup as their Kubernetes environments rapidly expanded.
![[?]](https://assets.chaos.social/accounts/avatars/000/086/780/original/7699ff6b67e4070f.jpg)
Read-only Friday!
Heute schau ich mir mal die Optimierungen für #Grafana Produkte an.
Also #Loki, #Alloy, #Prometheus und #Cortex
Hinsichtlich Memory/CPU usage.
Auf den Satelliten soll diese möglichst gering sein. Darf auch langsam werden dadurch.
Auf dem zentralen System darfs mehr brauchen, wenn's dafür schneller wird.
Mal sehen was Caching bringt!
![[?]](https://media.norden.social/accounts/avatars/108/193/889/569/700/052/original/5023314f05a37299.jpg)
Also da kannste nichts sagen. Habe 7 Anwendungen von einem #raspberrypi in #Container auf einen #proxmox Server in 1,5 Stunden mit #claudecode umgezogen und konnte nebenher andere Sachen machen. Da waren keine ganz einfachen Sachen dabei. Unter anderem #Grafana / #Prometheus #Datenbank etc.. Das war großes Tennis und eine echte Erleichterung.
👇 Learn why #Spotify Engineering relied on #VictoriaMetrics for extreme #Scale observability in this case study.
https://bit.ly/49e5P6w
#Proxmox #PVE #monitoring #metrics #opensource
https://gyptazy.com/blog/grafana-dashboard-for-pegaprox-prometheus-exporter/
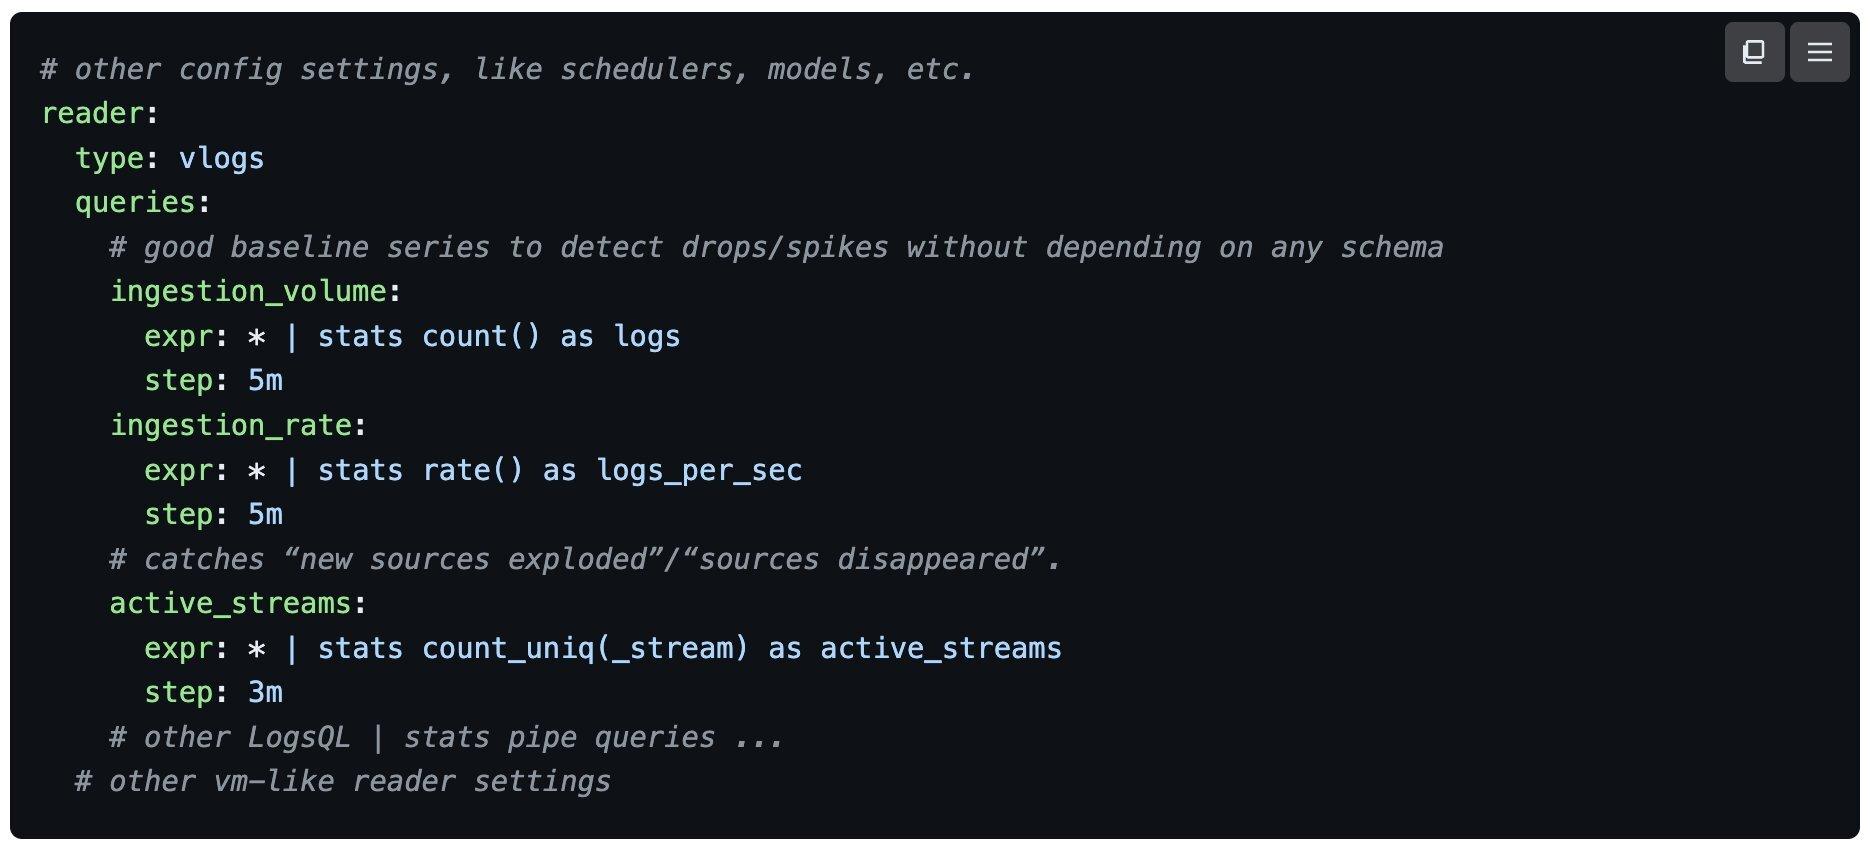
Anomaly detection isn't just for metrics.
#VictoriaMetrics Anomaly Detection supports additional input data sources through #VictoriaLogs reader, allowing you to monitor #log-derived and traces-derived metrics for anomalies.
This expands the versatility, enabling it to handle a wider range of data sources beyond #timeseries metrics from VictoriaMetrics or #Prometheus, including VictoriaLogs and #VictoriaTraces.
![[?]](https://assets.chaos.social/accounts/avatars/108/239/985/224/807/017/original/99e35a161d253ded.jpeg)
![[?]](https://cdn.masto.host/enosmtown/accounts/avatars/109/341/527/116/255/990/original/16fee146425349c3.jpg)
RE: https://en.osm.town/@mdione/116239489362801981
OK, the push for AI is official. I'm definitely open for new positions.
I'm a jack of all trades, systems dev and admin, #Linux, #Python, #postgres, #ansible, #prometheus, #grafana, security conscious, I like to review code, and for my hobbies I do some #GIS and would like to do more.
Check my CV https://www.grulic.org.ar/~mdione/
and my blog https://www.grulic.org.ar/~mdione/glob/ (not a typo)
for more details.
Marcos Dione boostedI have been suggested that the company I'm working is not doing well. Than and a push for AI is telling me it's maybe time to move on.
What am I? Currently I'm doing #Python, #SysAdmin, GitHub/GitLab admin (yes, both), some Kafka, used to do some Postgres (now we have a DB team), Ansible and more.
Edit: more info: https://en.osm.town/@mdione/116302423501761728
What do I want? No AI, no gambling, no blockchain. In #Marseille or remote. I can invoice abroad, but I would rather be an employee.
1/
![[?]](https://media.hachyderm.io/accounts/avatars/110/951/731/365/927/189/original/b2c68992ae4f02d2.jpg)